


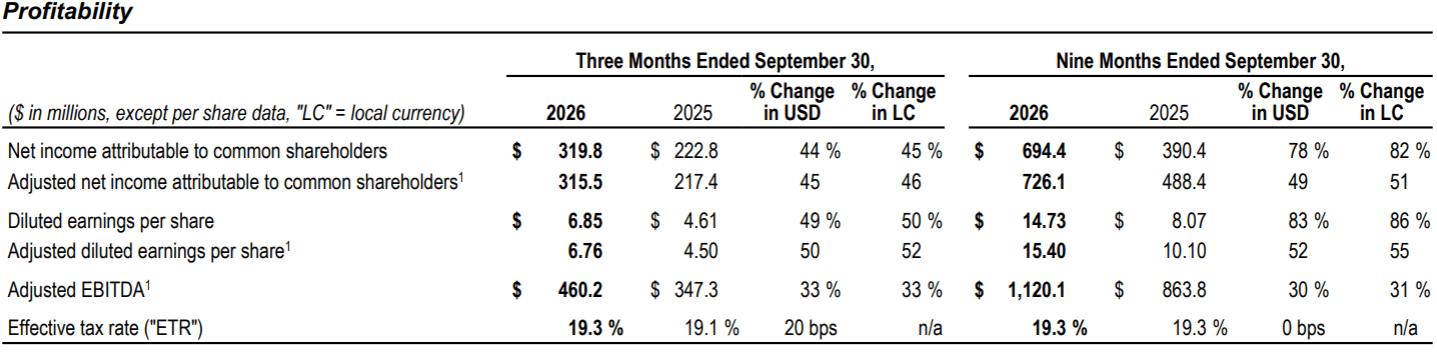
Jones Lang LaSalle Incorporated (NYSE: JLL) today reported strong operating performance for the third quarter of 2026. Diluted earnings per share was $6.85, up 49% in USD and 50% in local currency (LC), and adjusted diluted earnings per share was $6.76, up 50% in USD and 52% in LC. Net income attributable to common shareholders grew 44% in USD and 45% in LC while Adjusted EBITDA increased 33% in USD and LC to $460.2 million.
"JLL's record third quarter at the top and bottom line reflected our track record of converting growth into margin-accretive profit," said Christian Ulbrich, JLL CEO. "Given the strength of our pipelines and operating trends, we are optimistic about a strong finish to 2026 and have raised our full-year Adjusted EPS target range, reflecting 37% growth at the midpoint. Our focus on generating robust free cash flow and maintaining an agile financial profile allows us to invest strategically for long-term growth while deploying capital opportunistically. Our imminent $500 million accelerated share repurchase underscores our conviction in our long-term strategy to build an even more integrated and resilient JLL."
Revenue
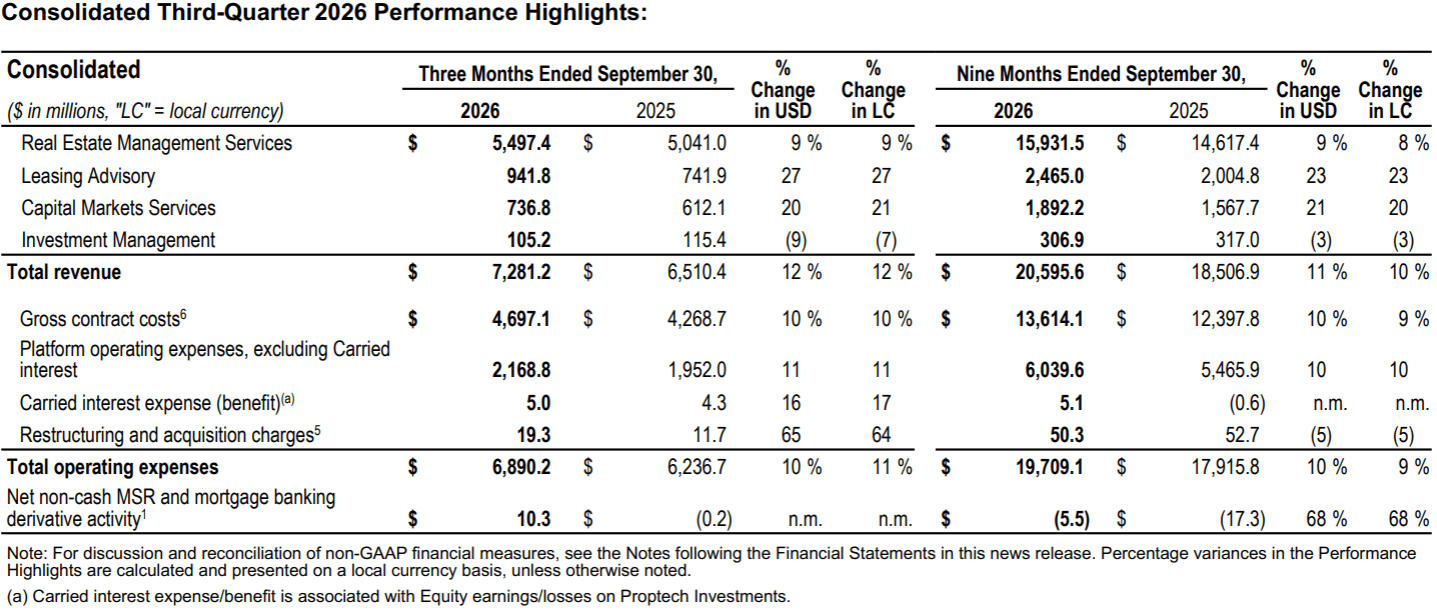
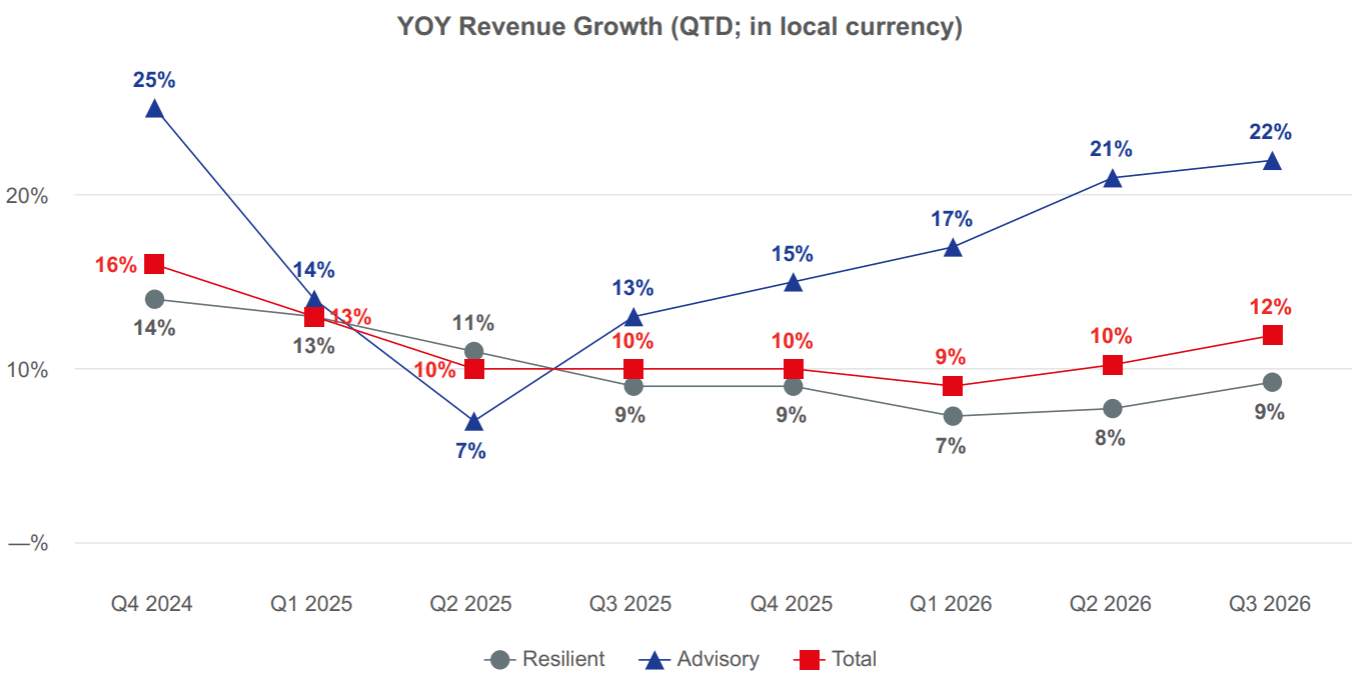
Revenue increased 12% compared with the prior-year quarter. Collectively, Advisory revenue growth accelerated to 22% and was led by Leasing Advisory, up 27%, and Investment Sales, Debt/Equity Advisory and Other, within Capital Markets Services, up 23% (excluding the impact of non-cash MSR and mortgage banking derivative activity). The aggregate 9% increase in Resilient revenues was highlighted by Workplace Management, up 10%, and Project Management, up 14%, both within Real Estate Management Services. Refer to segment performance highlights for additional detail.
Profitability
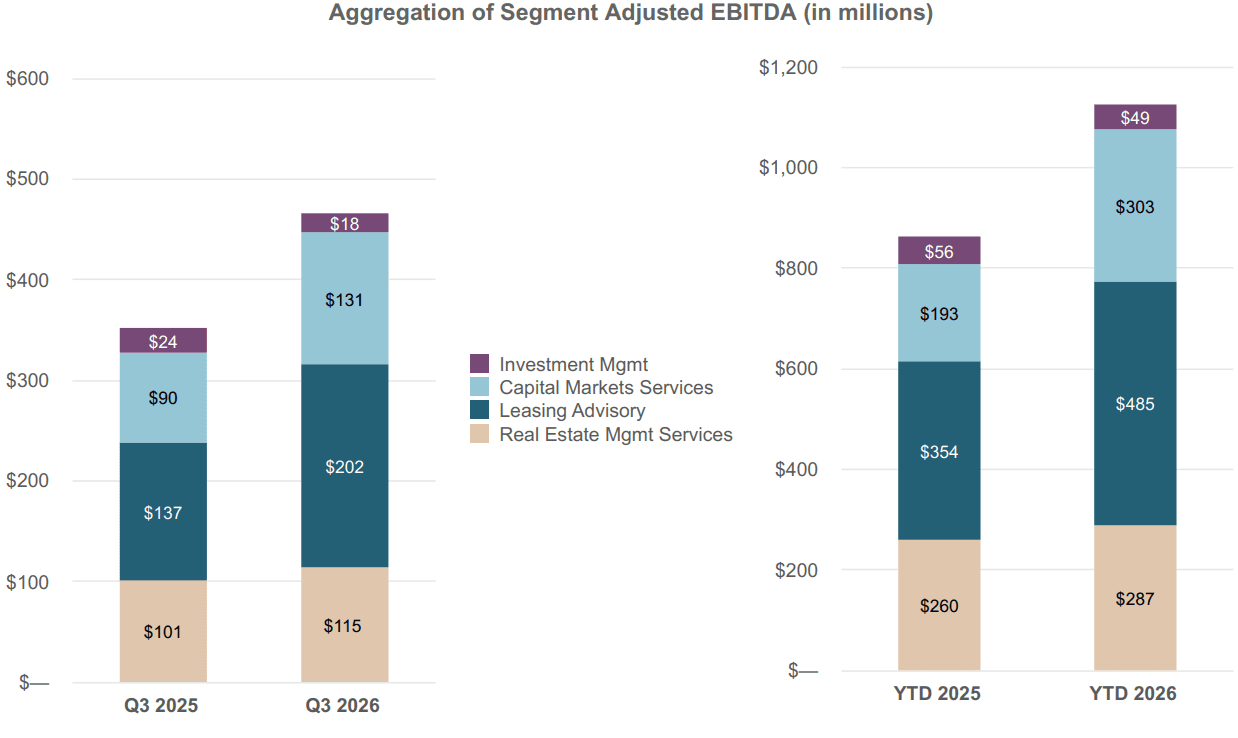
For the quarter, higher Adjusted EBITDA and margin were primarily driven by Leasing Advisory and Capital Markets Services, reflecting strong revenue growth, with incremental profit contributions from Real Estate Management Services. In addition, margin expansion reflected enhanced platform leverage. Current-quarter performance also reflected lower loan-related expenses, including the absence of loan loss expense recognized in the prior-year quarter. Refer to the segment performance highlights for additional detail.
As indicated in Note 7, Proptech Investments are presented outside of our reporting segments in "All Other" and not included within segment AdjustedEBITDA. Therefore, the aggregation of segment Adjusted EBITDA does not sum to consolidated totals.
Cash Flows and Capital Allocation:
For the nine months ended September 30, 2026, the significant year-over-year improvement in operating cash flows was driven by higher cash provided by earnings. The Free Cash Flow increase was attributable to the improvement in operating cash flows and also reflected higher capital expenditures, primarily associated with technology infrastructure and investments in workspace optimization.

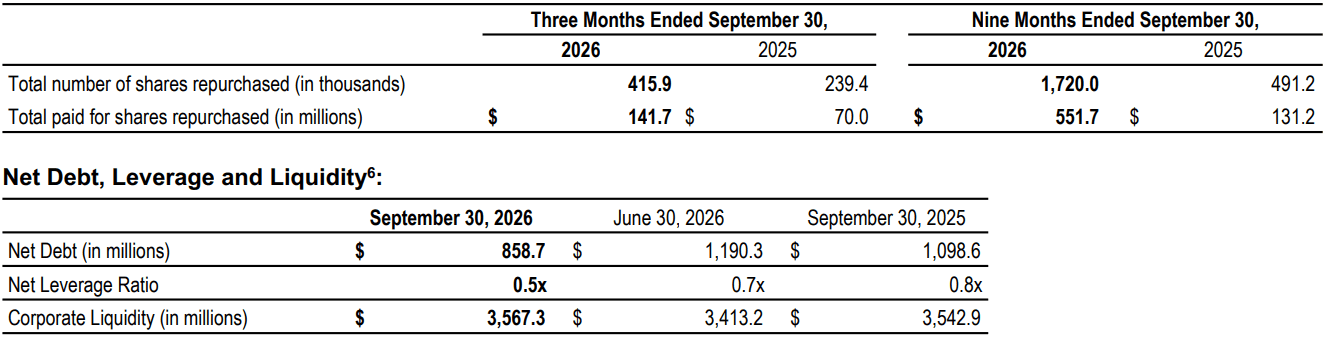
The lower Net Debt, compared with June 30, 2026, was primarily attributable to positive free cash flow for the third quarter. The Net Debt reduction from September 30, 2025, reflected improved free cash flow over the trailing twelve months ended September 30, 2026, compared with the trailing twelve months ended September 30, 2025.
In addition to the Corporate Liquidity detailed above, we maintain a commercial paper program (the "Program") with $2.5 billion authorized for issuance. As of September 30, 2026, there was $113.5 million outstanding under the Program.
Real Estate Management Services Third-Quarter 2026 Performance Highlights:
Compared with the prior-year quarter, Real Estate Management Services revenue growth was attributable to continued momentum in Workplace Management and accelerated growth in Project Management. Within Workplace Management, the increase was driven by a largely balanced mix of mandate expansions and new client wins. Project Management's double-digit growth follows a strong third-quarter 2025 (up 38% on a two-year stacked basis) with higher pass-through costs augmenting a mid single-digit management fee increase. This growth was led by the U.S. and India, which outpaced softness in Australia and certain geographies in Europe.
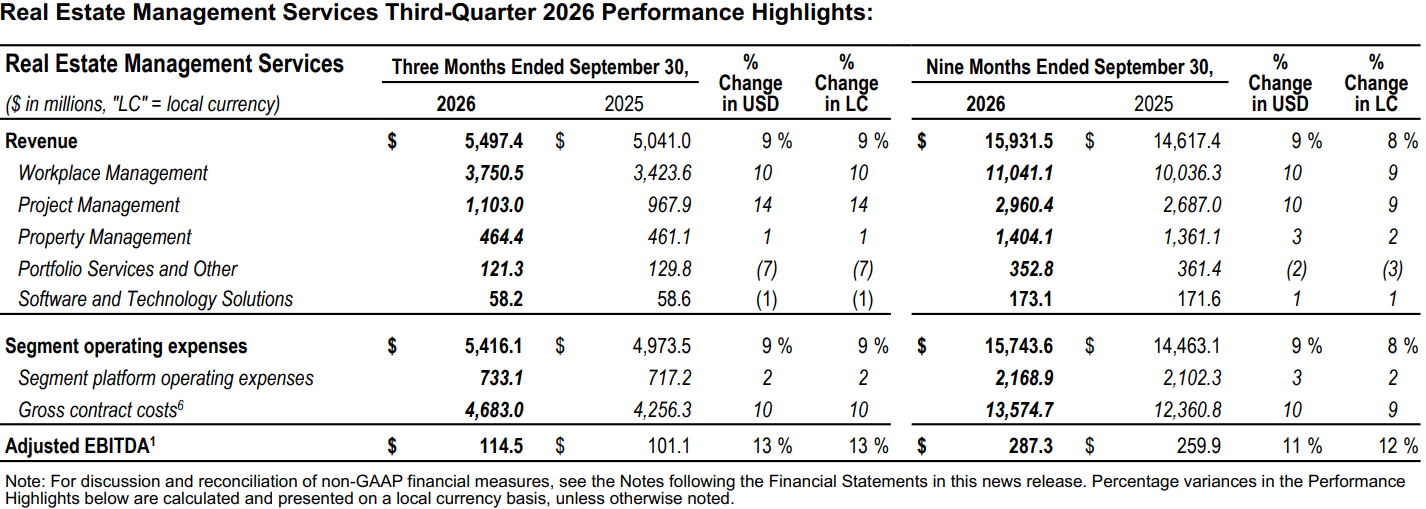
Higher Adjusted EBITDA and margin were primarily attributable to the revenue growth described above and incremental platform leverage.
Leasing Advisory Third-Quarter 2026 Performance Highlights:
Higher Leasing Advisory revenue, compared with the prior-year quarter, was driven by accelerated momentum in the U.S., most notably in the industrial, office and data center asset classes. Geographically, the strong U.S. growth (up 39%) significantly outpaced softness in certain geographies within Europe and Asia Pacific. Broad-based asset class growth across the U.S. was primarily due to a meaningful uptick in average deal size. Office leasing revenue growth outperformed global office volumes (up 9% compared with market volumes (a) up 5%), highlighted by U.S. revenue outperformance (up 18% compared with market volumes (a) up 2%). U.S. industrial leasing revenue growth also outperformed industrial volumes (up 56% compared with market volumes (a) up 38%).
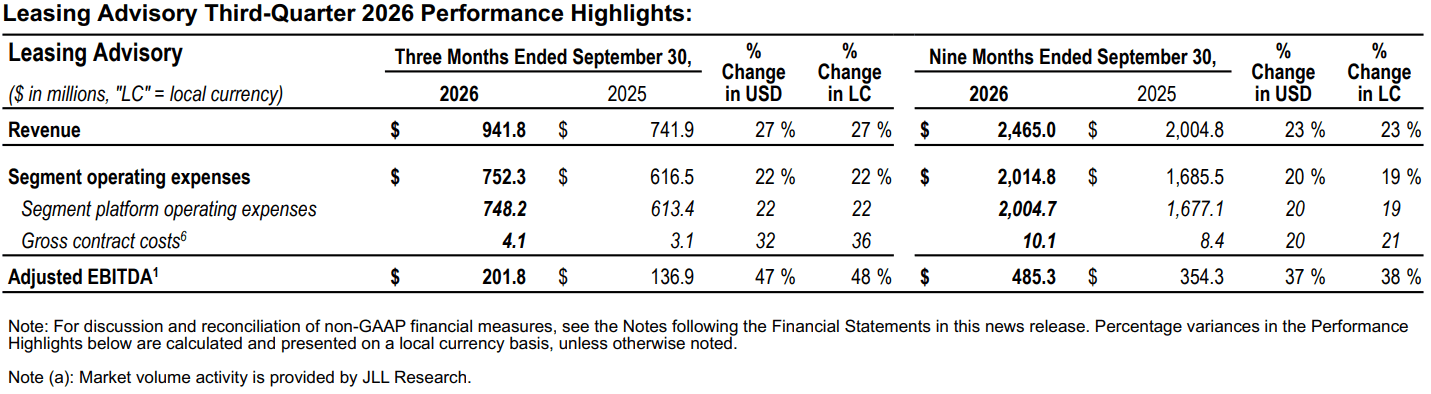
The increase in segment platform operating expenses was primarily attributable to higher commission expense, driven by the revenue growth. Consistent with the first half of 2026, larger average deal size drove a higher average commission rate as higher tiers were achieved earlier this year.
Adjusted EBITDA and margin expansion were driven by revenue growth, net of higher commission expense, coupled with incremental platform leverage.
Capital Markets Services Third-Quarter 2026 Performance Highlights:
Capital Markets Services top-line growth was broad-based across nearly all major geographies and sectors, led by investment sales along with robust debt advisory and equity advisory transactions. Investment sales grew 33% (55% on a two-year stacked basis), while debt advisory was up 13% (61% on a two-year stacked basis) and equity advisory was up 39% (126% on a two-year stacked basis) compared with the prior-year quarter. Geographically, the increase in segment revenue was led by the U.S. and Japan. Investment sales revenue growth of 33% globally and 34% in the U.S. outpaced the broader market (a), which grew 9% and 11%, respectively, over the same period.
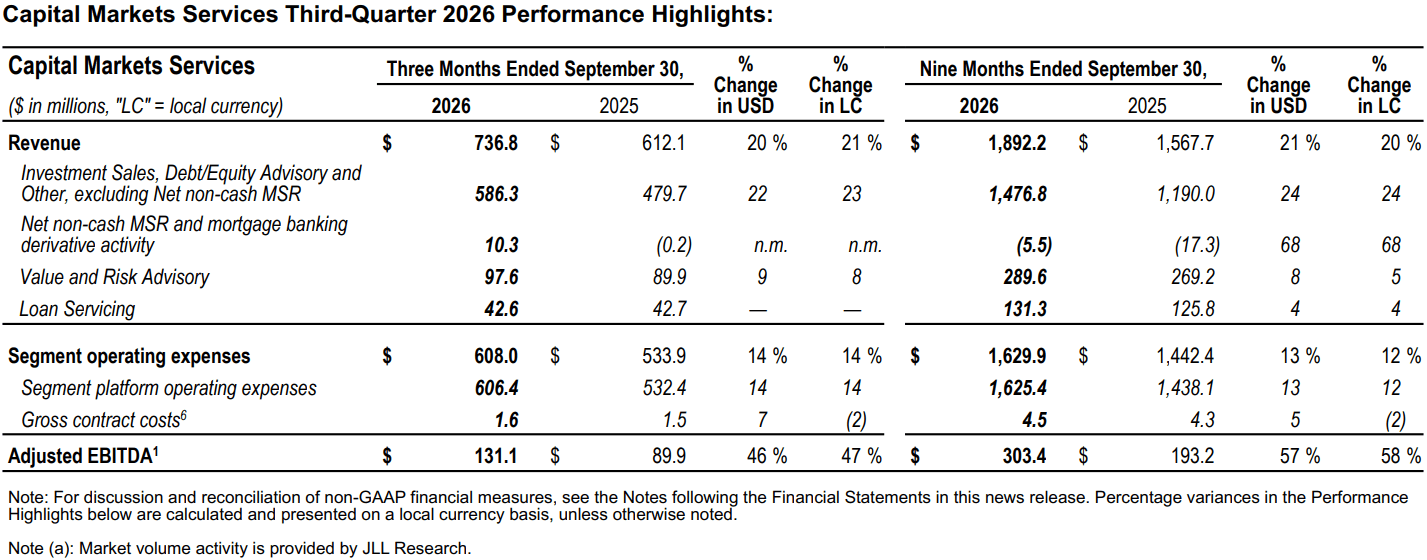
Higher segment platform operating expenses were substantially driven by increased commission expense, correlating with the strong revenue growth. The higher average commission rate, versus the comparative period, reflected both the earlier achievement of higher commission tiers and the geographic mix of revenue. Segment platform operating expenses also reflected $6.8 million of lower loan-related expenses, including the absence of loan losses recognized in the prior-year quarter.
Higher Adjusted EBITDA and margin expansion for the quarter were primarily attributable to strong revenue growth, net of higher commission expense, as well as lower loan-related expenses noted above and incremental platform leverage.
Investment Management Third-Quarter 2026 Performance Highlights:
Compared with the prior-year quarter, lower Incentive and transaction fees drove the decline in Investment Management revenue. Advisory fees were largely steady, as growth from recent capital raising in the Americas was offset by anticipated lower fees from funds in Asia Pacific, as discussed in recent quarters.
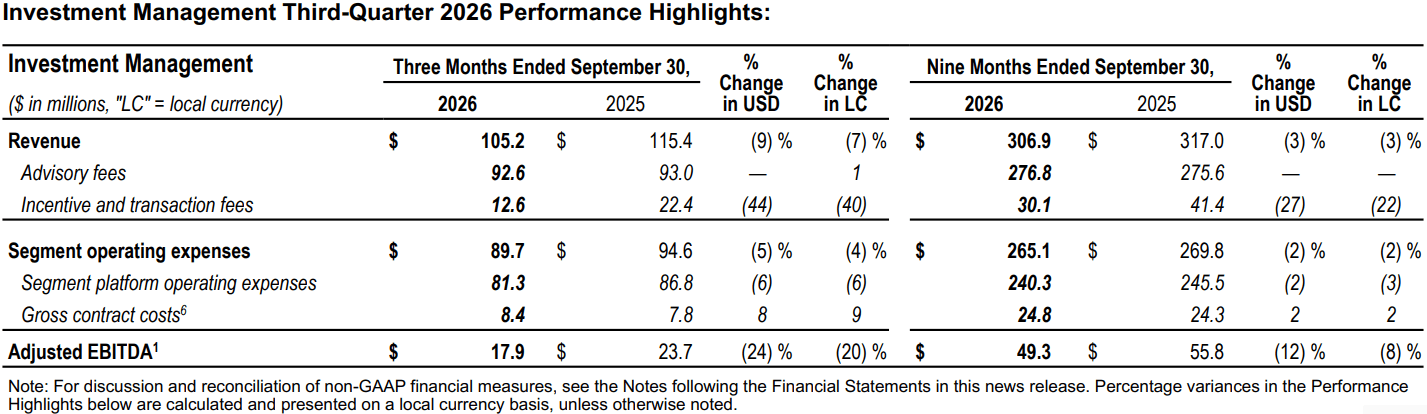
The change in Adjusted EBITDA and margin primarily reflected the lower incentive and transaction fees noted above, net of lower incentive compensation costs.
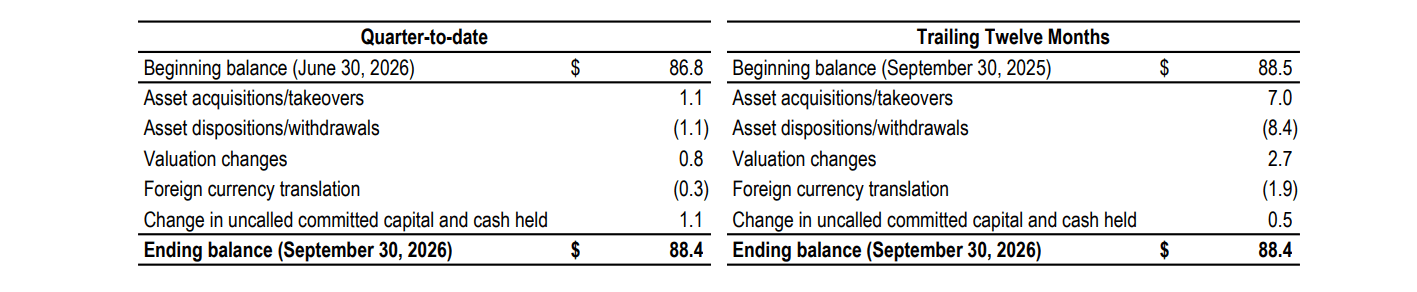
Assets under management (AUM) increased 2% in both USD and local currency during the quarter. Over the trailing twelve months, AUM was flat in USD and increased 2% in local currency. Changes in AUM (3) are detailed in the tables below (in billions):