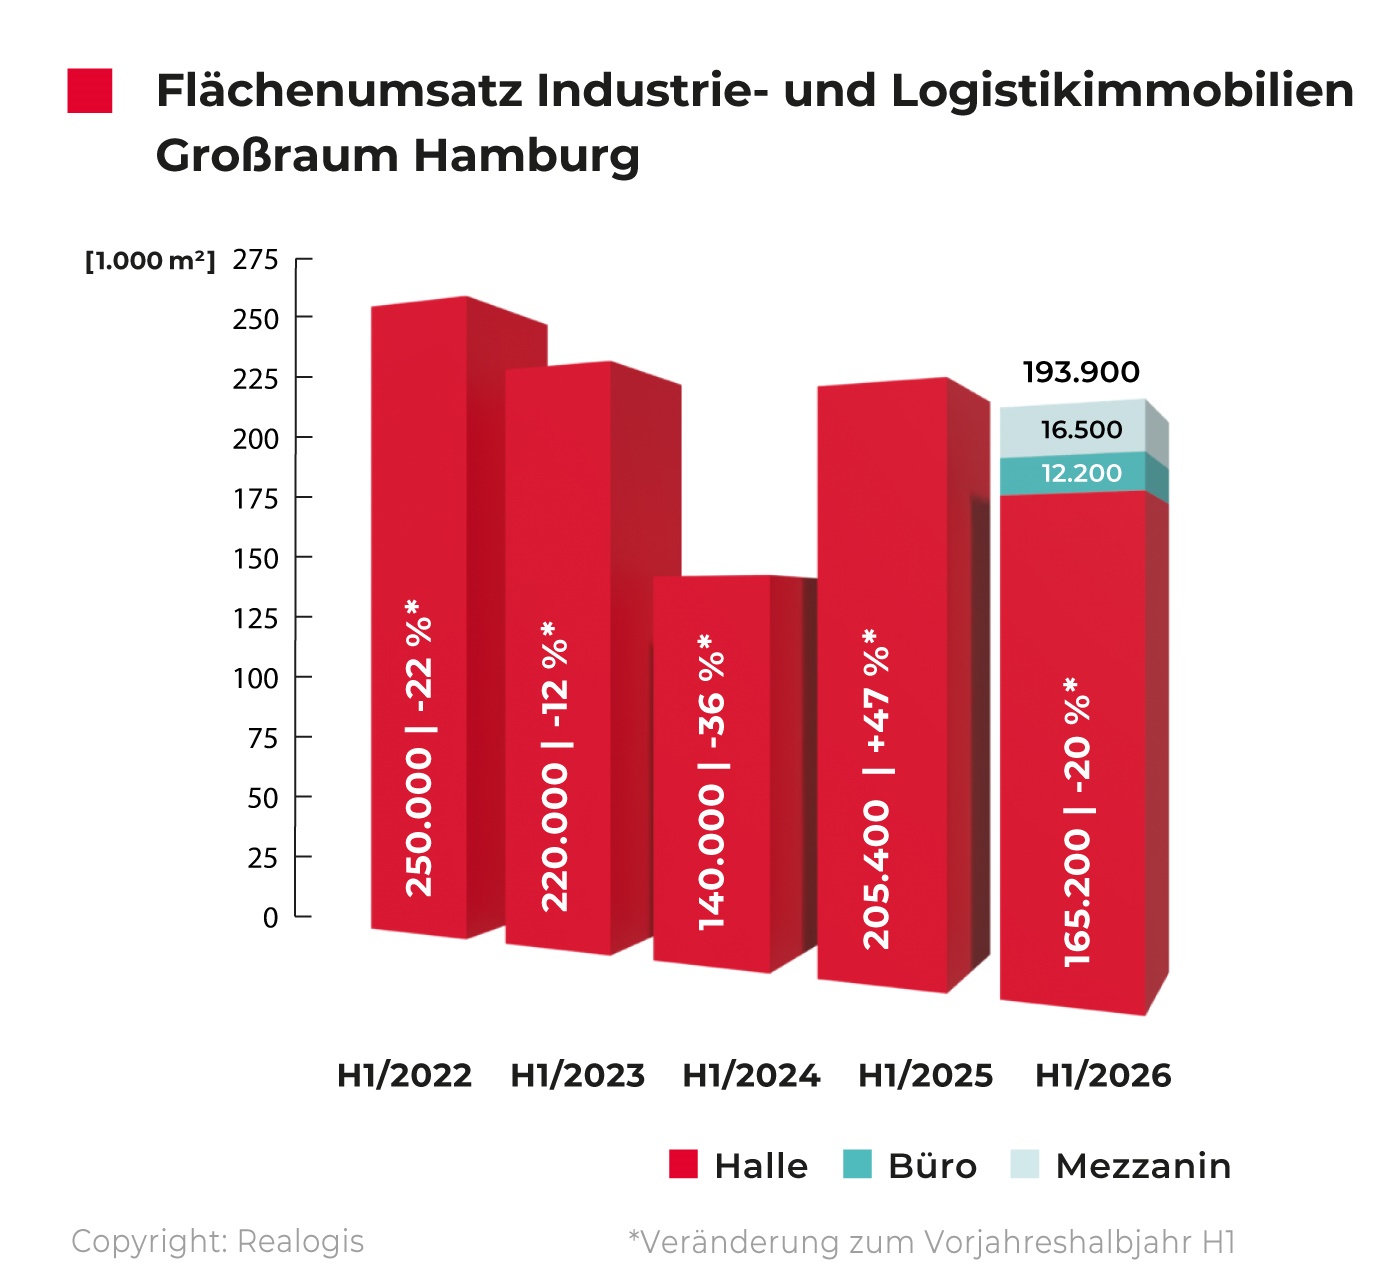

The REALOGIS Group, Germany’s leading consulting firm for industrial and logistics real estate as well as commercial properties, recorded total take-up of 193,900 m² in the Hamburg market for industrial and logistics real estate in the first half of 2026. Of this, 165,200 m² or 85% was pure hall space, 16,500 m² (9%) mezzanine space and 12,200 m² (6%) office space. Take-up of hall space fell by 40,200 m² (20%) compared to the same period of the previous year, and the current 5-year average of 196,120 m² in this segment was missed by 16%.
The three largest deals were concluded by an e-commerce user in Hamburg East with 62,610 m², an aviation company in Hamburg South with 21,610 m² and Blitz Distribution in Hamburg South with 20,860 m². They accounted for 105,080 m² or 54% of total take-up.
Stefan Imken, Managing Director of REALOGIS Immobilien Hamburg GmbH, puts it in perspective: “A few large-volume deals have supported the Hamburg market so far this year. Apart from these major deals, demand was more subdued. The fact that all of the take-up was achieved in existing properties indicates a limited supply of new construction.”
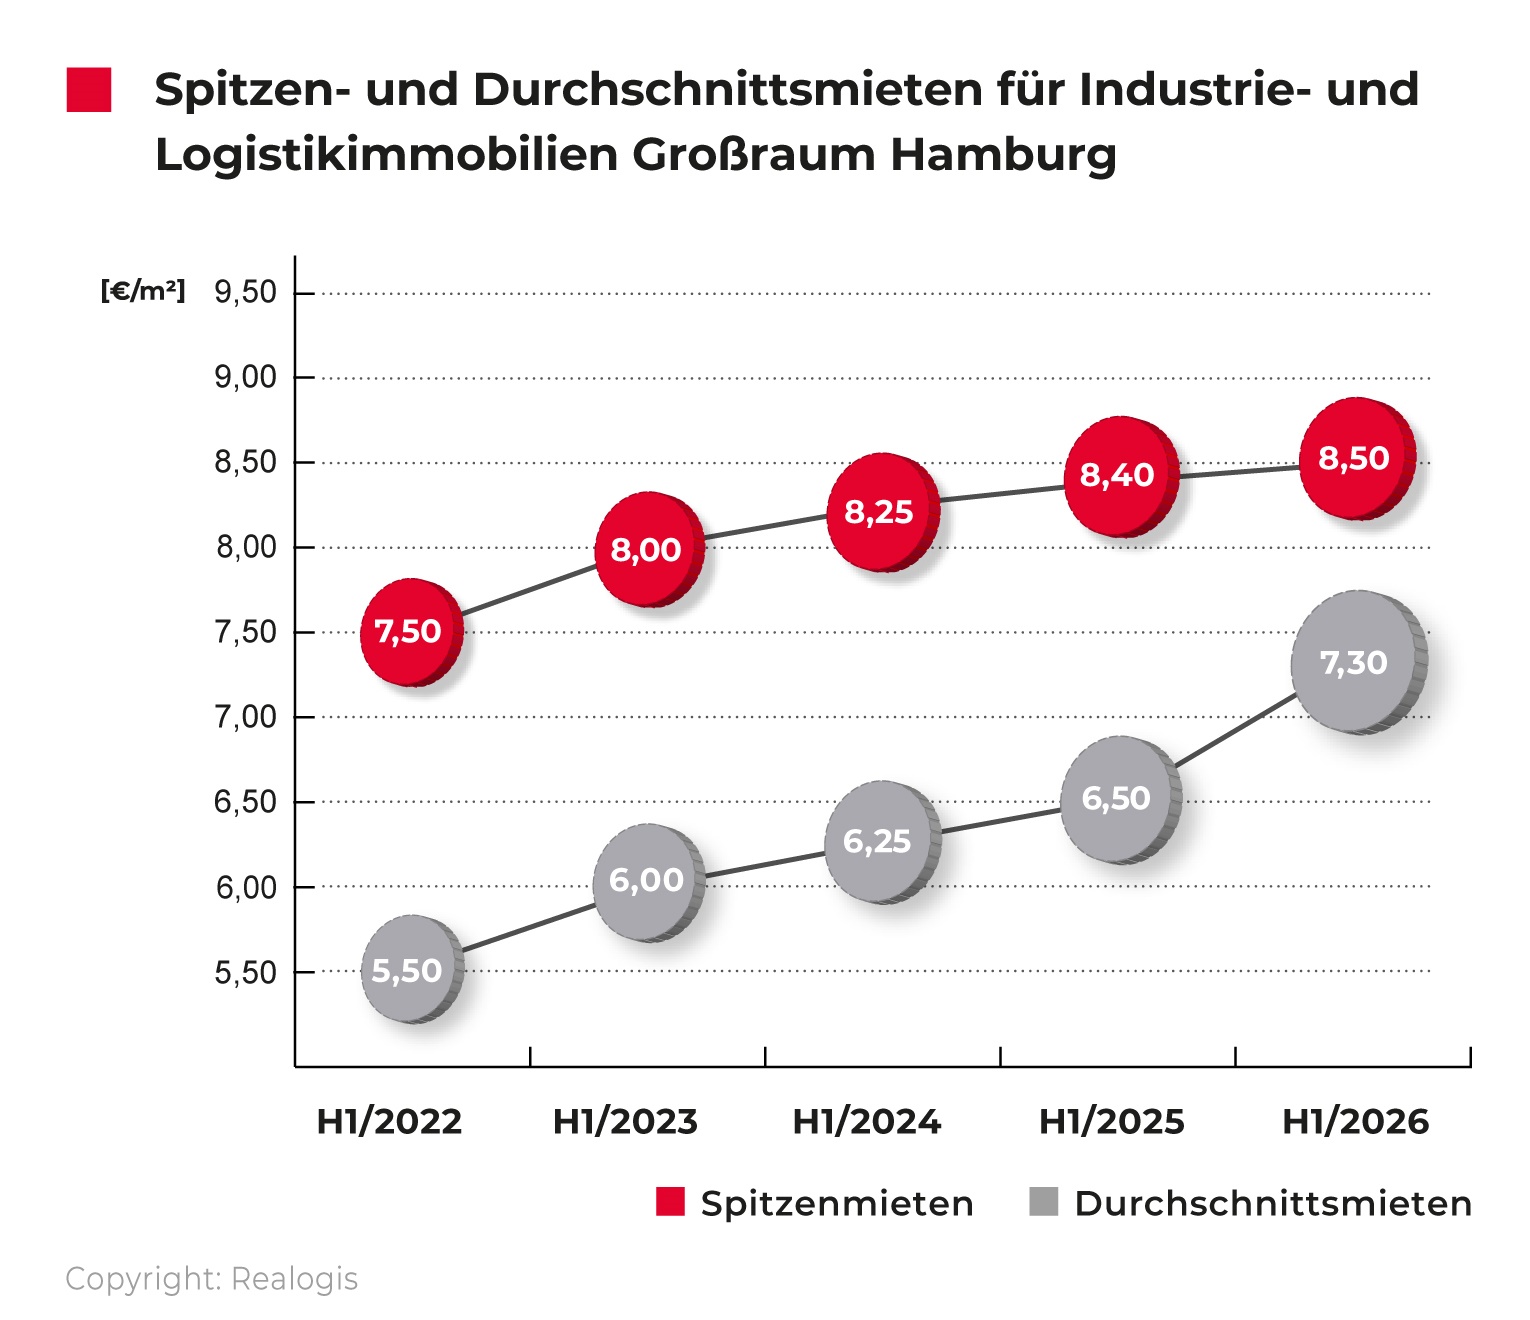
Rents: Average rent increased significantly, prime rent remains up
Rents continued to rise in the 1st half of 2026, albeit with different dynamics. At €8.50/m², the prime rent was €0.10/m² or 1% higher than at the same time a year earlier and €0.20/m² (2%) higher than at the end of 2025. The current 5-year average of €8.13/m² was exceeded by 5%.
The average rent increased by €0.80/m² or 12% to €7.30/m² compared to the 1st half of 2025. Compared to the end of 2025 (€6.40/m²), the increase was €0.90/m² or 14%. The current 5-year average of €6.31/m² was exceeded by 16%.
This means that the continuous upward trend in rents registered since the 1st half of 2018 continued, with average rents both in absolute and percentage terms stronger than in all previous half-year periods.
Types of buildings: Big box stocks determined the market picture
By building type, big-box properties dominated with 126,200 m² or 65% of total take-up. Areas that cannot be assigned to big-box properties or business parks followed with 53,400 m² (28%). Business parks accounted for 14,300 m² (7%).
Regions: Hamburg East focused on the urban area
With 146,000 m² or 76%, the Hamburg urban area was by far the sub-region with the highest take-up. The three largest deals in the first half of the year represented 105,080 m² or 72% of take-up within the city area.
Within the city limits, Hamburg East was clearly ahead with 94,100 m² or 65%. The southern urban area reached 46,900 m² (32%). In the west of Hamburg, take-up amounted to 5,000 m² (3%). No financial statements were registered in Hamburg North.
With 23,900 m² or 12%, Hamburg’s southern region ranked second among the sub-regions. The northern area followed with 15,800 m² (8%). The western area accounted for 5,800 m² (3%) and the eastern area 2,400 m² (1%).
Market structure: Tenants alone accounted for take-up
The Hamburg market area was a pure rental market in the 1st half of 2026. Owner-occupier contracts were not registered.
Industries: E-commerce Certain rental activity in the retail sector
With 101,900 m² or 53%, retail companies ranked first among the user groups. The decisive factor was e-commerce, which accounted for 99,800 m² or 98% of the industry’s turnover within the retail sector. The two largest deals of an e-commerce company and Blitz Distribution GmbH together accounted for 83,470 m². This means that they accounted for 84% of take-up in the e-commerce sub-segment. Brick-and-mortar retail contributed 2,100 m² (2%) to retail space take-up.
The logistics/freight forwarding sector followed in second place with 69,600 m² or 36%. The financial statements of an aviation company in Hamburg accounted for 21,610 m² (31%) of the industry’s turnover. Industry/production took third place with 16,400 m² (8%). The collective category “Other” came to 6,000 m² (3%).
Size classes: Large units account for the bulk of the half-year result
Large areas from 10,001 m² shaped Hamburg’s market activity. This size class accounted for 105,080 m² or 54% of total take-up. The segment’s revenue was generated entirely by the three largest deals of the first half of the year.
The category of larger areas from 5,001 to 10,000 m² followed with 46,500 m² or 24% market share. This means that space of 5,001 m² or more together accounted for 78% of total take-up. Medium-sized areas between 3,001 and 5,000 m² accounted for 21,800 m² (11%). Areas between 1,000 and 3,000 m² contributed 10,700 m² (6%). At 9,820 m² (5%), very small areas of less than 1,000 m² played a minor role.
Key figures at a glance
• Take-up: 193,900 m²
• Prime rent: €8.50/m²
• Average rent: €7.30/m²
• Existing areas: 193,900 m² | New building on a greenfield site: 0 m² |
New building on brownfield: 0 m²
• Tenants: 193,900 m² | Owner-occupier: 0 m²